Chart from the same report
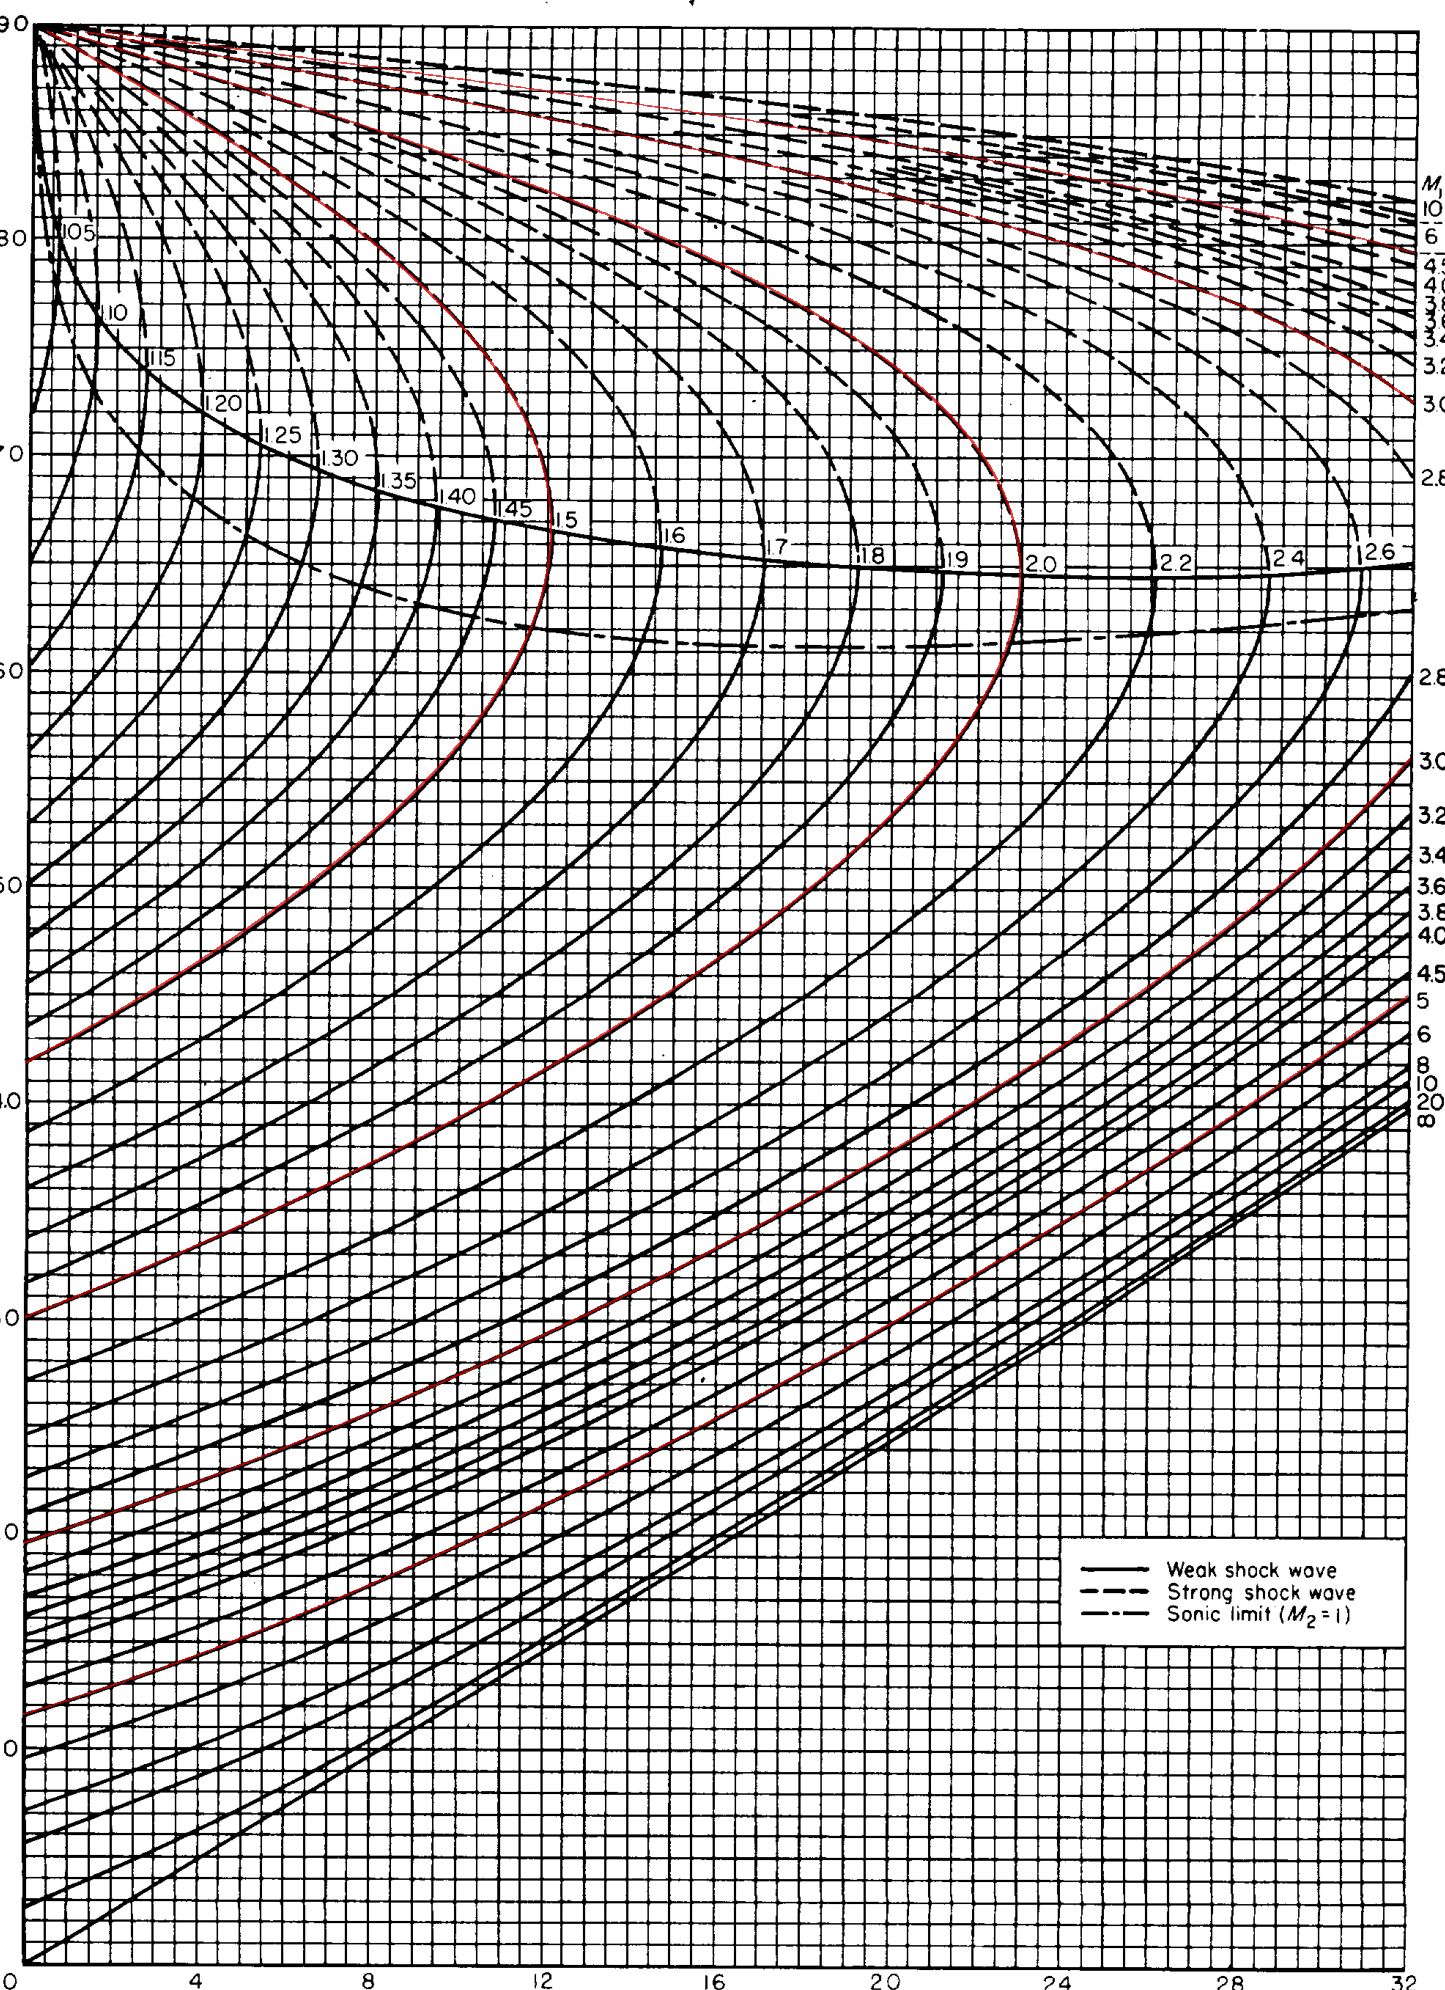
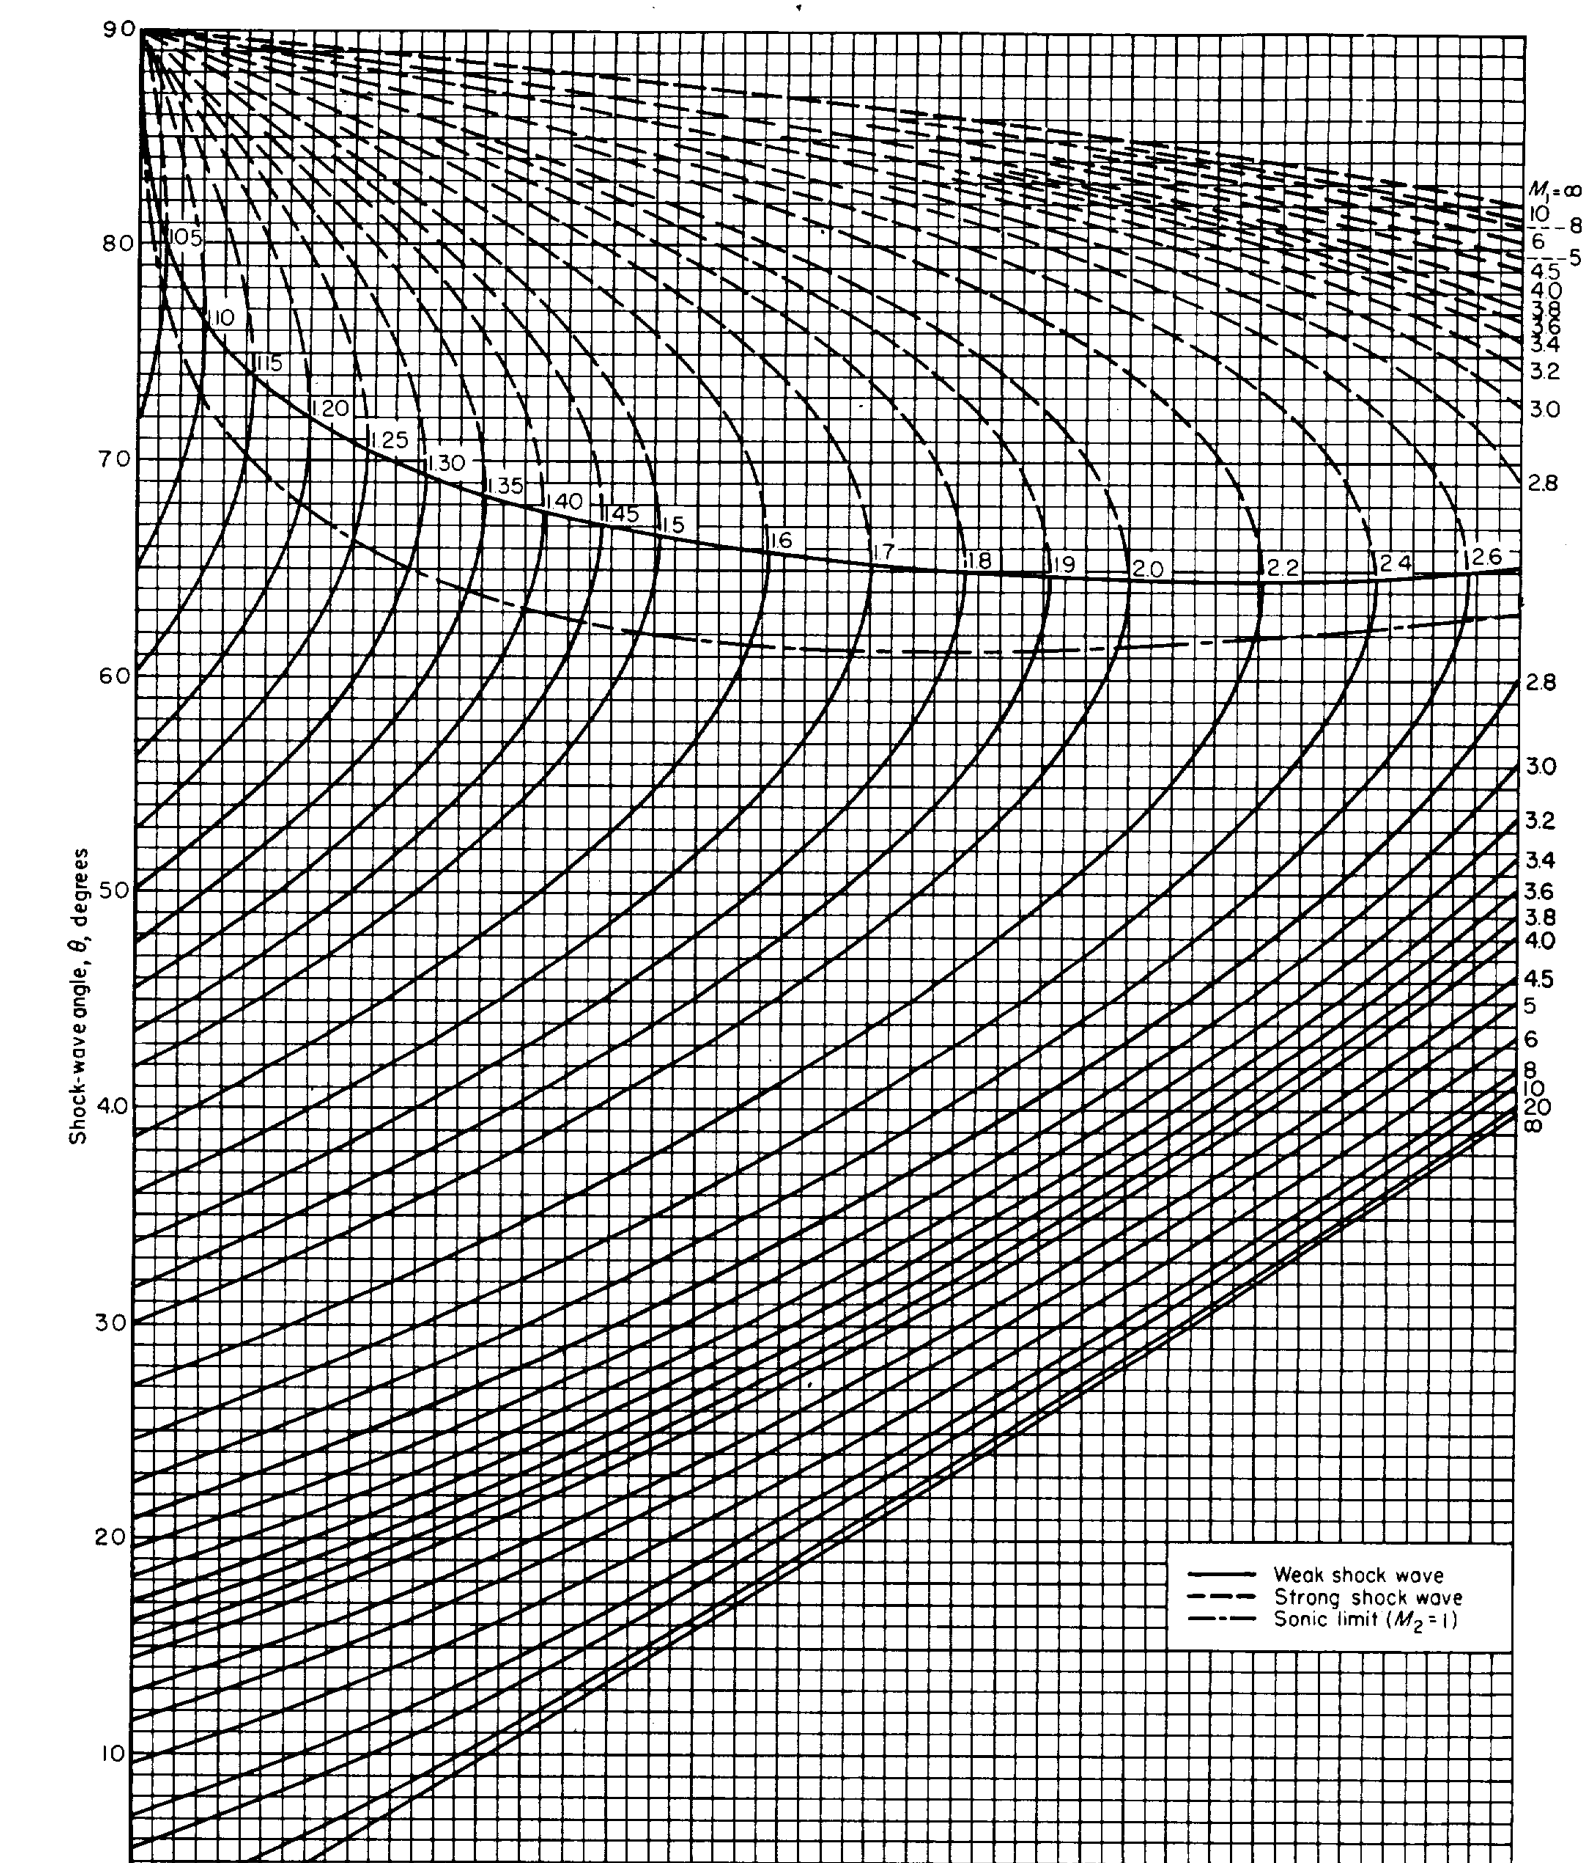
This is Chart 2 from the same report. It shows how the angle of a shock wave changes with the flow deflection angle, with a separate curve for each Mach number. A screen reader cannot interpret a picture like this, so we wrote a short description and pulled the numbers out into a table.
The scan
What we made
Line chart. Horizontal axis: deflection angle δ, 0 to 32 degrees. Vertical axis: shock wave angle θ, 0 to 90 degrees. There is one curve for each upstream Mach number, from 1.05 up to infinity.
You use it by picking your Mach number curve, finding your deflection angle along the bottom, and reading the shock angle off the side. Each curve starts on the left edge (δ = 0) and rises as δ gets bigger, until it reaches the largest deflection that Mach number can handle. Then it turns back up toward 90 degrees. The lower part of each curve is the weak shock (solid line), the upper part is the strong shock (dashed line). Higher Mach numbers start lower and reach further to the right.
| Deflection δ | M = 1.5 | M = 2 | M = 3 | M = 5 |
|---|---|---|---|---|
| 0° (where the curve starts) | 41.8° | 30.0° | 19.5° | 11.5° |
| 5° | 47.9° | 34.3° | 23.1° | 15.1° |
| 10° | 56.7° | 39.3° | 27.4° | 19.4° |
| 15° | n/a | 45.3° | 32.2° | 24.3° |
| 20° | n/a | 53.4° | 37.8° | 29.8° |
| 25° | n/a | n/a | 44.1° | 35.8° |
| 30° | n/a | n/a | 52.0° | 42.3° |
| Largest δ on the curve | 12.1° | 23.0° | 34.1° | 41.1° |
n/a means that Mach number's curve ends before it gets to that angle. We used the same equation the chart was drawn from to get these numbers, and checked them against standard published values.
See our numbers drawn on top of the scan (red)